Protein isoelectric point calculator
Comparision of IPC to other pKa sets (on 25% of datasets not used for training)
|
Method |
Protein dataset |
|
Method |
Peptide dataset |
||||
|
RMSD |
% |
Outliers |
|
RMSD |
% |
Outliers |
||
|
IPC_protein Toseland Bjellqvist& Dawson Wikipedia Rodwell Grimsley Solomon Lehninger ProMoST Nozaki Thurlkill DTASelect EMBOSS Sillero Patrickios Avg_pI* |
0.874 0.934 0.944 0.945 0.955 0.963 0.968 0.970 0.970 0.978 1.024 1.030 1.032 1.056 1.059 2.392 0.965 |
0 14.9 17.7 17.8 20.5 22.8 24.2 24.8 25.0 27.3 41.3 43.4 44.1 52.3 53.2 3201.8 23.3 |
46--- 52--- 47--- 56--- 55--- 58--- 60--- 58--- 59--- 53--- 56--- 61--- 58--- 69--- 63--- 227--- 52--- |
|
IPC_peptide Solomon Lehninger EMBOSS Wikipedia Toseland Sillero Dawson Thurlkill Rodwell DTASelect Nozaki Grimsley Bjellqvist& ProMoST Patrickios Avg_pI |
0.251 0.255 0.262 0.325 0.421 0.425 0.428 0.435 0.481 0.502 0.550 0.602 0.616 0.669 1.377 1.998 0.370 |
0 0.9 2.5 18.5 47.9 49.1 50.3 52.9 69.7 78.4 99.1 124.3 131.4 161.5 1236.5 5479.1 31.5 |
232-- 235-- 236-- 372-- 1467-- 990 1223-- 1432-- 1361-- 1359-- 1714-- 1368-- 1550-- 1583-- 2661-- 2739-- 985-- |
* average from all pKa sets without Patrickios (highly simplified pKa set) and IPC sets
& Bjellqvist is implemented as e.g. ExPASy Compute pI/Mw
% - note that pH scale is logarithmic with base 10, thus percent difference corresponds to pow(10, x) where x is equal to delta of RMSD of two error estimates represented in pH units e.g. % difference between Toseland and IPC_protein is pow(10, (0.934-0.874)), for better explanation why this should be calculated like that see ... here
Protein dataset (IPC_protein was trained on 1,743 proteins with 10-fold cross-validation - data in next table, below, tested on 581 proteins not used for training - data in the table above), peptide dataset (IPC trained on 12,662 peptides with 10-fold cross-validation - data in next table below, tested on 4,220 peptides not used for training - data in the table above). Outliers correspond to the number of predictions for which difference between experimental pI and predicted pI was bigger than threshold of mean standard error (MSE) of 3 for protein dataset and MSE of 0.25 for peptide dataset.
Statistics for different pKa sets on 75% training datasets (10-fold cross-validatated)
|
Method |
Protein dataset |
|
Method |
Peptide dataset |
||||
|
RMSD |
% |
Outliers |
|
RMSD |
% |
Outliers |
||
|
IPC_protein Toseland Bjellqvist& Dawson Wikipedia Rodwell Grimsley Solomon Lehninger ProMOST Nozaki Thurlkill DTASelect EMBOSS Sillero Patrickios Avg_pI* |
0.8376 0.8984 0.9223 0.9202 0.9304 0.9383 0.9388 0.9465 0.9473 0.9517 1.0052 1.0180 1.0169 1.0402 1.0421 2.2365 0.9425 |
0 15.0 21.5 20.9 23.8 26.1 26.2 28.5 28.7 30.0 47.1 51.5 51.1 59.4 60.1 2405.1 27.3 |
114 131 149 156 157 159 147 159 160 141 169 173 167 189 188 645 154 |
|
IPC_peptide Solomon Lehninger EMBOSS Wikipedia Sillero Toseland Dawson Thurlkill Rodwell DTASelect Nozaki Grimsley Bjellqvist& ProMOST Patrickios Avg_pI |
0.2473 0.2508 0.2575 0.3222 0.4125 0.4260 0.4269 0.4316 0.4798 0.5055 0.5413 0.599 0.6108 0.6610 1.3745 1.9770 0.3668 |
0 0.8 2.4 18.8 46.3 50.9 51.2 52.9 70.8 81.2 96.8 124.8 130.9 159.2 1240.3 5266.8 48.3 |
635 638 643 1088 4280 3025 3618 4192 4017 4061 4902 4013 4609 4672 8055 8131 2895 |
Changes in method order in comparison to previous table are bolded.
Statistics for different pKa sets for SWISS-2DPAGE and PIP-DB separately
|
Method |
SWISS-2DPAGE |
|
Method |
PIP-DB |
|
||||
|
RMSD |
% |
|
Outliers |
RMSD |
% |
Outliers |
|||
|
IPC_protein Toseland Bjellqvist& Dawson Wikipedia Rodwell Grimsley Solomon Lehninger ProMOST Nozaki Thurlkill DTASelect EMBOSS Sillero Patrickios Avg_pI* |
0.4764 0.5211 0.5903 0.5987 0.6194 0.6276 0.5715 0.6354 0.6400 0.6139 0.6788 0.6909 0.6773 0.7240 0.7205 1.5995 0.6107 |
0 10.9 30.0 32.5 39.0 41.7 24.5 44.2 45.8 37.3 59.4 63.9 58.8 76.9 75.5 1227.9 36.3 |
|
10 18 31 37 35 37 21 44 44 29 43 39 35 49 50 243 35 |
IPC_protein Toseland Bjellqvist& Dawson Wikipedia Rodwell Grimsley Solomon Lehninger ProMOST Nozaki Thurlkill DTASelect EMBOSS Sillero Patrickios Avg_pI* |
1.0188 1.0859 1.0845 1.0806 1.0868 1.0948 1.1213 1.1029 1.1019 1.1237 1.1647 1.1798 1.1863 1.1982 1.2017 2.6228 1.1071 |
0 16.7 16.3 15.3 16.9 19.1 26.6 21.4 21.1 27.3 39.9 44.9 47.1 51.2 52.4 3918 22.5 |
141 153 150 161 163 167 170 159 161 151 170 176 173 191 187 604 158 |
|
Both SWISS-2DPAGE and PIP-DB were cleaned from outliers (MSE >3 between experimental pI and average predicted pI) and clustered by CD-HIT with 99% sequence identity threshold as described in Datasets (982 and 1307 proteins respectively), but they were not divided into training and testing datasets, thus results for IPC sets can by slightly overestimated, yet this is not a relevant issue as seen from comparison of previous tables. Changes in method order in comparison to Table 1 are bolded.
Experimental versus theoretical isoelectric points for proteins datasets (SWISS-2DPAGE and PIP-DB) calculated using EMBOSS pKa set.
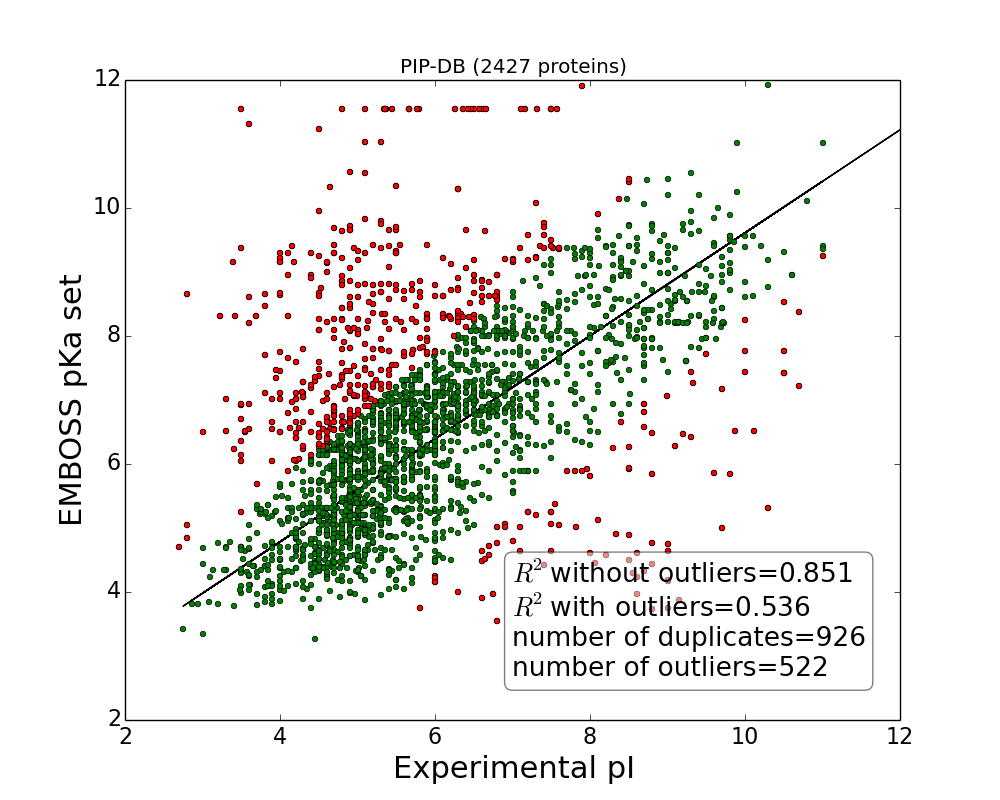
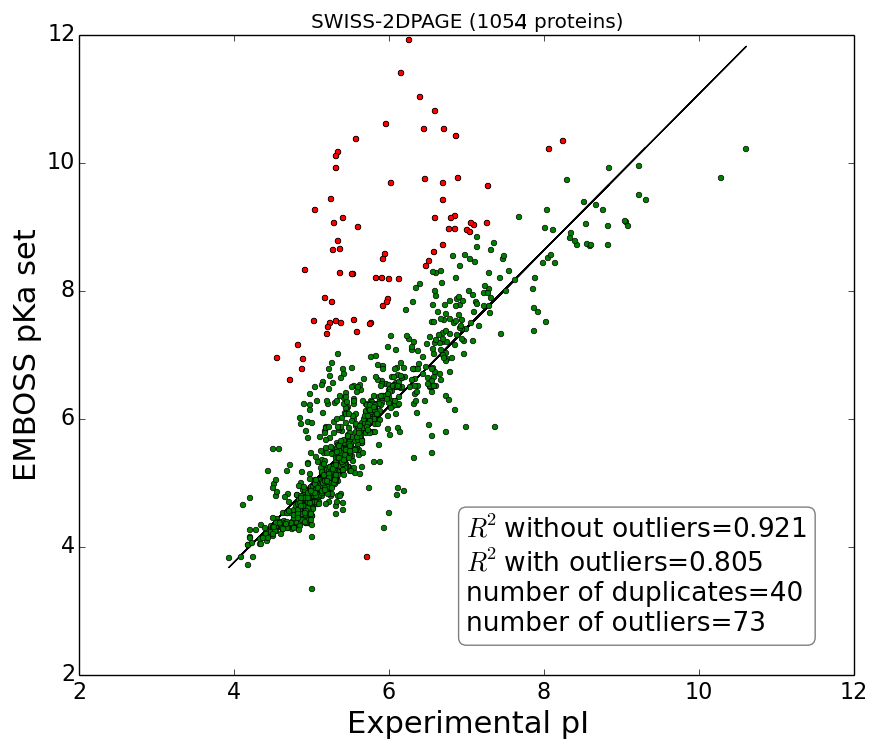
Outliers defined as MSE>3, marked red. Note, plots correspond to datasets as presented by authors before cleaning and removing duplicates (duplicates are defined as records which has the same sequence and yet referred as separate records in database although in both databases authors many times report multiple pI from different experiments in one record, nevertheless for current analysis average pI was used). Solid line represent linear regression fitted to data after removing outliers.
Experimental versus theoretical isoelectric points for the main protein dataset (merge of SWISS-2DPAGE and PIP-DB, including training and test sets) calculated using different pKa sets

R2 – Pearson correlation before removing outliers. R2corr – Pearson correlation after removing outliers. Additionally, linear regression models fitted to predictions with outliers (magenta line) and without outliers (blue line) are shown. Outliers (marked magenta) are defined as pI predictions with MSE>3 in comparison to experimental pI, other predictions are represented as heat maps according to density of points. Number of outliers for both training and testing set together.
Interesting facts about protein isoelectric point
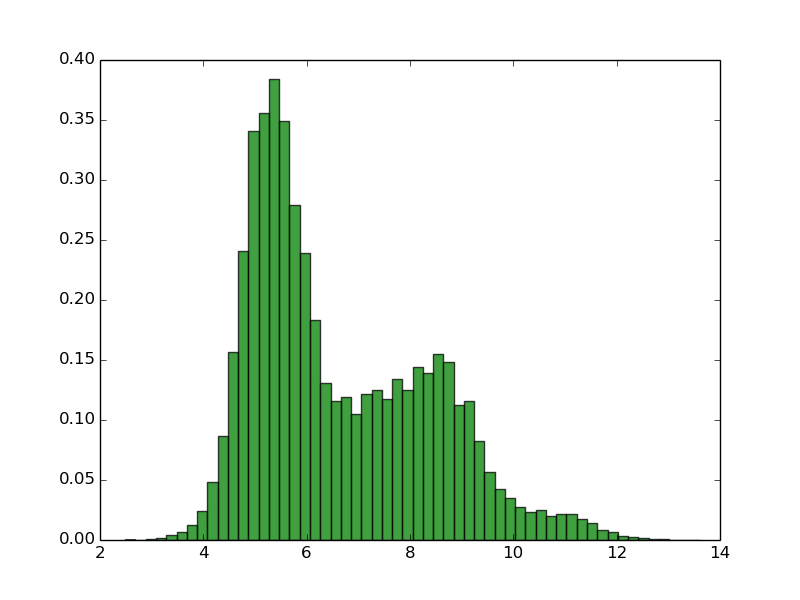
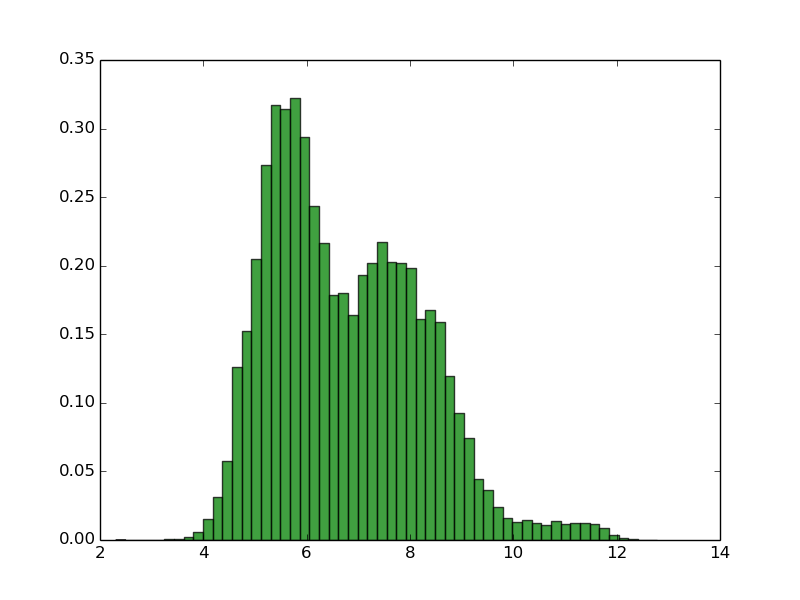
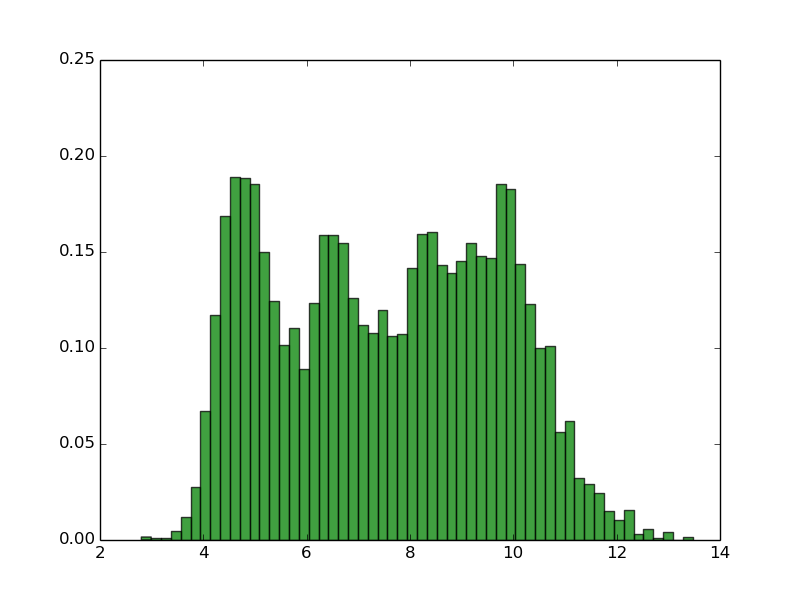
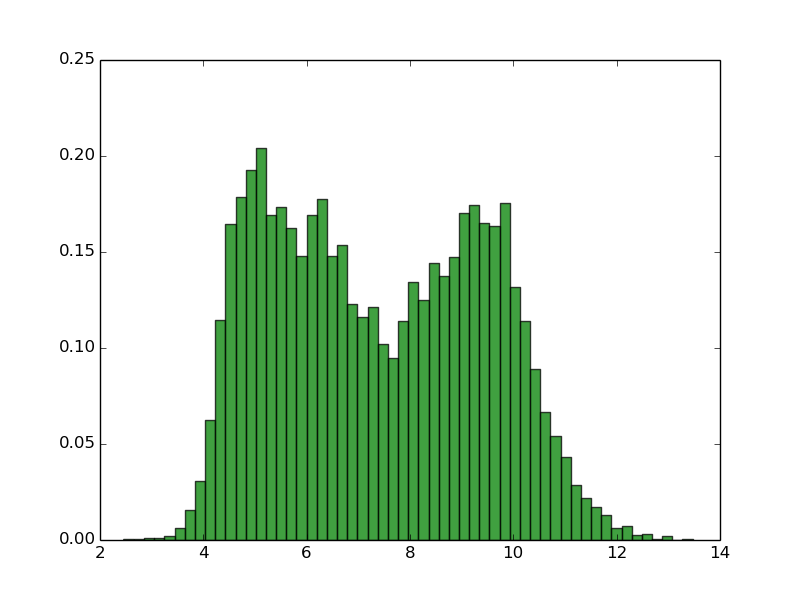
Swiss_prot (90% identity, 318k proteins) Escherichia coli (4128 proteins) Homo sapiens (99739 proteins)
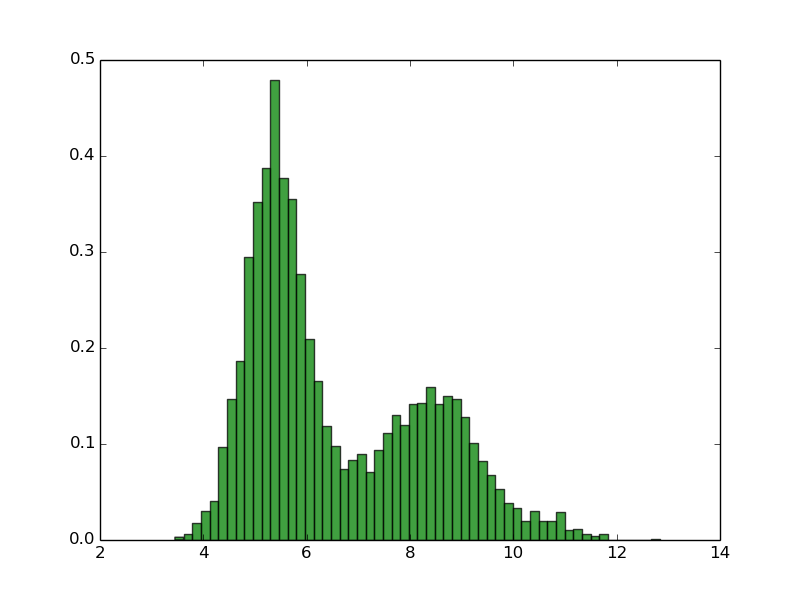
As you can see, normally proteomes have bimodal distribution of pI with very low fractions of proteins with pI close to 7.4 This is due the fact that the proteins are mostly insoluble, less reactive and unstable in pH close to pI, and pH inside of the the cell is close to 7.4. Thus, this property of proteomes could be the result of evolutionary selection to avoid this. Of course there are some exceptions. Many of halophilic Archaeons do not even try to force high concentration of salt of their environment, instead they change their physiological pH inside of the cell to more similar to environment (in this way they use less energy to keep the homeostasis). This has dramatic consequence for the amino acid composition and isoelectric point of theirs proteins. For more informations see: doi:10.1186/1471-2164-8-163
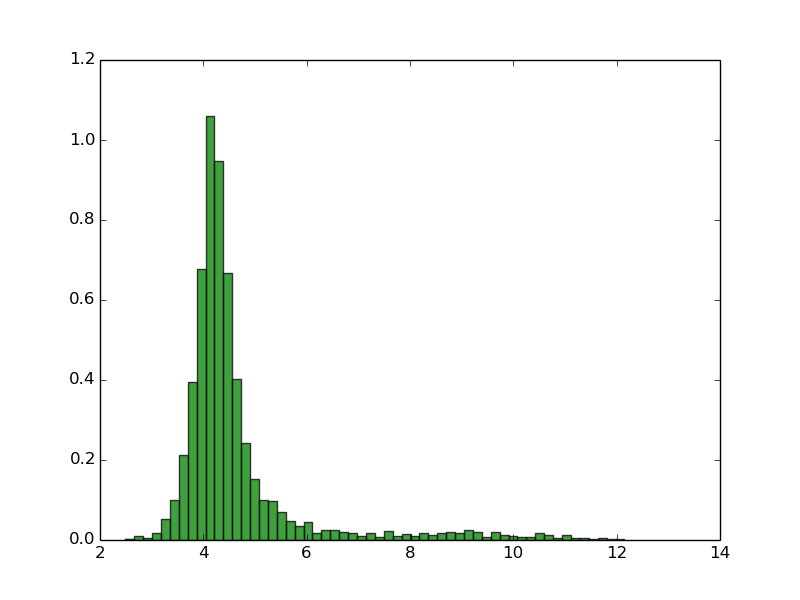
Natrialba magadii (3559 proteins)
Implications
EMBOSS IPC_protein